Data Table
Table 2. Influence of mistletoe on Oregon White Oak (Quercus garryana) tree characteristics and American Robin (AMRO) and Black-Capped Chickadee (BCCH) presence within five Oregon-based sites. For variables: Specs = Number of species observed, Mst = Mistletoe level, ht = tree height, swell = percent of tree swollen, dead% = percent of tree canopy that is dead wood, loose = percent loose/missing wood on tree, cav = number of decay cavities, Oak = number of competing poison oak shrubs. Table is indicative of 6 rows, from a 60 sample table, including 5 sites and 46 species presence. Table data modified and sourced from Pritchard et al. (2017).
Table 2. Influence of mistletoe on Oregon White Oak (Quercus garryana) tree characteristics and American Robin (AMRO) and Black-Capped Chickadee (BCCH) presence within five Oregon-based sites. For variables: Specs = Number of species observed, Mst = Mistletoe level, ht = tree height, swell = percent of tree swollen, dead% = percent of tree canopy that is dead wood, loose = percent loose/missing wood on tree, cav = number of decay cavities, Oak = number of competing poison oak shrubs. Table is indicative of 6 rows, from a 60 sample table, including 5 sites and 46 species presence. Table data modified and sourced from Pritchard et al. (2017).

Sampling units for this study were defined as 60 individual White Oak trees (originally sorted as 30 independent pairs) within the Willamette Valley. Site ID and site name composed metadata (design variables), while predictor and response variables fluctuate depending on the objective being met. For objective one - mistletoe influence on microhabitats - a categorical predictor variable of mistletoe infection level (high/low) was used, with continuous response variables being the microhabitat characteristics. For objective two - mistletoe infection levels alter bird presence and similarity - the categorical predictor of mistletoe infection level first defines a second set of independent, continuous predictors of microhabitat characteristics. These predictors each then elicit a categorical response for bird species (binary, presence/absence). Under either objective, there is no active treatment or manipulation, and all predictors are observed as is on tree samples.
Exploratory graphics
Figures 2.0 to 2.5 are box plots comparing high and low mistletoe infection levels against the different microhabitat characteristics. Some forest attributes such as canopy volume, DBH, and height had little differences between infection levels (figure 2.0, 2.3, and 2.4). And others such as deadwood percentage, loose wood percentage and number of cavities had a large difference between the infection levels by looking at the IQR, regardless of significance (figure 2.1, 2.2, 2.5). The horizontally extended lines that are within the interquartile range box on both sides of the mean dot is our standard errors. In all 3 of deadwood percentage, loose wood, and cavities the standard error lines do not overlap, and are indicative of woody debris differences between high mistletoe and low mistletoe infections. The generalized pairs plot indicates strongest correlation between dead and loose wood, which is expected given the similar conditions they arise under. The canopy, DBH, and height, are also well correlated, indicating a normalized growth and standard conditions for forest study.

Figure 2.0. - Boxplot of canopy volume (cm^3) as a function of high/low mistletoe infection levels. Black circle is indicative of sample mean based off 60 individual samples, with interval bars indicating standard error.

Figure 2.2. - Boxplot of loose wood (% of bark) as a function of high/low mistletoe infection levels. Black circle is indicative of sample mean based off 60 individual samples, with interval bars indicating standard error. |

Figure 2.1. - Boxplot of deadwood (percent of canopy) as a function of high/low mistletoe infection levels. Black circle is indicative of sample mean based off 60 individual samples, with interval bars indicating standard error.

Figure 2.3. - Boxplot of dbh (mm) as a function of high/low mistletoe infection levels. Black circle is indicative of sample mean based off 60 individual samples, with interval bars indicating standard error.
|

Figure 2.4. - Boxplot of tree height (m) as a function of high/low mistletoe infection levels. Black circle is indicative of sample mean based off 60 individual samples, with interval bars indicating standard error.
|

Figure 2.5. - Boxplot of number of cavities (n) as a function of high/low mistletoe infection levels. Black circle is indicative of sample mean based off 60 individual samples, with interval bars indicating standard error.
|
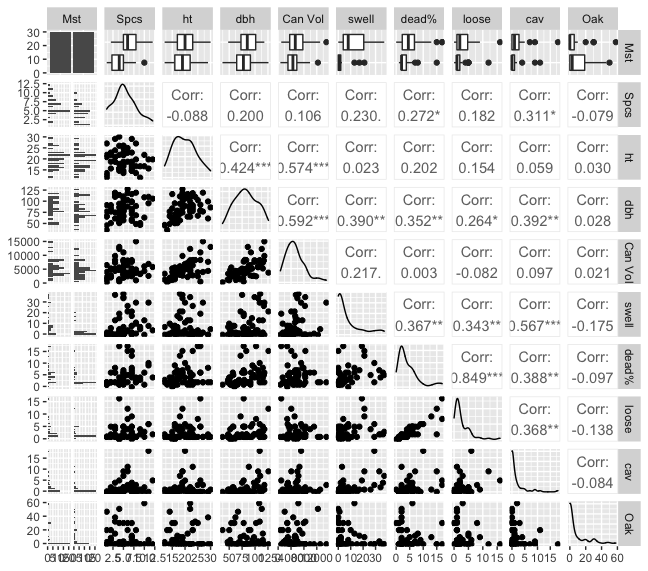
Figure 3. - Generalized pairs plot and resulting correlation between microhabitat parameters for high and low mistletoe infection site at 5 Oregon - based sites. For variables: Specs = Number of species observed, Mst = Mistletoe level, ht = tree height, swell = percent of tree swollen, dead% = percent of tree canopy that is dead wood, loose = percent loose/missing bark on tree, cav = number of decay cavities, Oak = number of competing poison oak shrubs. Data modified and sourced from Pritchard et al. (2017)
Statistical Assumptions
Presented that ANOVA and linear regression would best describe mean differences between low and high mistletoe groups, and the need for normal data to accurately predict distributions under these statistics, an investigation of the normality and homogeneity of our data was required. Shapiro-Wilk's test and Levene's test were used to respectively test for normality and homogeneity of variances within our data. Shapiro-Wilk's test was used given its commonality, resistance to skews or kurtosis in small samples (~50), and standardization equations that allow the test to be a powerful predictor of normality or a lack thereof (Razali, 2011). Levene's test was chosen in a similar manner, being resistant to influences from non-normal data, which was suspected to be the case for much of our data (Nordstokke et al., 2011). Parameters meet the assumption of normality if their p-value is > 0.05, as per Shapiro-Wilk, and meet the assumption of homogeneity of variances if the Pr (>F) is > 0.05, as per Levene's test. As will be covered in the results, species, height, and DBH meet both assumptions, while canopy volume, percent dead wood, and number of cavities meet the homogeneity of variances assumption but not normality for objective 1 (Table 3). Swollen bark and percent dead wood fail to meet either assumption under objective 1. In Table 4 we can observe that all species meet both normality and homogeneity assumptions, with the exception of EUST and BHGR not having normal distributions. Therefore, at least some parts of our data violated normality and homogeneity for ANOVA tests in both objectives, and thus, non-parametric variants (PERMANOVA) were used. Given that PERMANOVA makes no assumption on the distribution or behaviour of our data, coupled with linear regression that requires no normality assumption, our tests then meet normality/homogeneity assumptions by largely proceeding without them.
