
Figure 4. -Non-metric multidimensional scaling (NMDS) using a Bray-Curtis distance matrix defining similarity between high and low mistletoe sites (red/blue points) and forest structure parameters (vector arrows) across 60 trees within five Oregon-based locations. Distance from zero indicative of increasing dissimilarity between sites, with proportion of dissimilarity attributable/controlled by vector arrows. The bottom axis consists of factors composing 34.11% of total dissimilarity, and the y-axis 19.82%. High mistletoe sites captured by the red circle, while low mistletoe sites are captured by blue circles, which represent means of all sites plus three standard deviations. Arrow labeling as follows: loose=loose wood percentage, dead%=deadwood percentage, cav=number of cavities, swell=amount of swelling, Spec=species, dbh=DBH, Ht=height, Canopy Vol=canopy vol, Oak=amount of oak trees. Data modified and sourced from an Oregon study by Pritchard et al. (2017)
Multidimensional (ordination) Scaling Matrix
Clumping of vector arrows in Figure 5 indicate a relative similarity of the species present for a large group of sites. The majority of species face no obvious skewing towards microhabitats and no major clumping is shown. One possible inference is that the Black-capped Chickadee (BCCH) is found in high numbers among some high mistletoe infection sites (Fin-Hi-10, Fin-Hi-7, Ow-Hi-4, Ow-Hi-3). A longer vector indicates the species is more common and composes more of the similarity of these sites. These sites encourage BCCH presence through some microhabitat difference from other sites (for example, Fin-Hi-10 and Fin-Hi-7 = high in dead/loose wood, Figure 4). This inference can be drawn about other strong vector responses, such as spotted towhee (SPTO), bullock’s oriole (BUOR), orange-crowned warbler (OCWA), western wood-pewee (WEWP), and European starling (EUST) species. Species moving in similar directions and strength of similarity, such as SPTO, BUOR, OCWA in the left-ward direction, are associated with similar microhabitats. Supplementing preference analysis in Figure 6, we can then infer that species such as BCCH, OCWA and species near high mistletoe sites prefer them with high mistletoe infection, while WEWP and EUST are mistletoe preferred but are attracted to features in low mistletoe trees. The many species with shorter vector arrows are less preferred or are in low counts and therefore less similar to outer sites, which themselves are more unique in compositions. Far outliers like Fin-Lo-1 and Fin-Lo-2 indicate an extreme microhabitat with very dissimilar species composition. However, reviewing survey data, these outliers and their similarities are based off a single species (BUOR and EUST respectively), and are likely not representative of true bird presence. |
Bray-Curtis Distance Graph
The Bray-Curtis distance graph describes the dissimilarity between the high and low mistletoe infection levels with respect to combinations of forest parameters. In Figure 4, using these spatial areas to answer our first objective, there is upper-left skew for high mistletoe sites (relative to center), indicating a similarity between IDs based on a high percentage of deadfall, loose wood, and trees with swelling and cavities. Conjointly, there is a slight bottom right skew for low mistletoe sights, indicating a commonality between low mistletoe sites for low or absent dead/ loose wood, and trees swelling and cavities. As well, microhabitat features like poison oak, number of species present, cavity and swelling, contribute less to the similarity and features present at sites, given their smaller vector arrows. DBH, height, and canopy volume, found on the bottom-left to top-right diagonal, contribute little to the skew, and all sites are relatively similar regarding these factors. Species counts are weakly associated with high mistletoe infections, as is low infection levels with poison oak, and it is likely that either absence of dead wood, or some unlisted variable controls low infection similarity. Using site IDs, all sites are moderately clumped within -0.2 and 0.2 (with -1 and +1 indicating imperfect/perfect similarity). Therefore, sites are relatively similar, with sites like Fin-Hi-12 (bottom left), Fin - Hi - 1 (middle-bottom) and other points further from zero considerably less common in microhabitat Sites Ba-Hi-1, Ba-Lo-1, and Ow-Hi-4 are far outliers, and are dissimilar from other sites based on greater combinations of dead/loose wood, cavities, and swelling. 
Figure 5. - Multidimensional (ordination) scaling matrix, measuring dissimilarity of mistletoe infection sites and present bird species for 30 paired tree samples across five Oregon-based locations. Distance from zero indicative of increasing dissimilarity between sites, with proportion of dissimilarity attributable/controlled by vector arrows, which represent preference of bird species towards sites in response to the above characteristics of mistletoe forests. Low infection sites are indicated by blue dots and high infection sites are indicated by red dots. Bird species represented by four letter representations, as per an Oregon study by Pritchard et al. (2017)
|
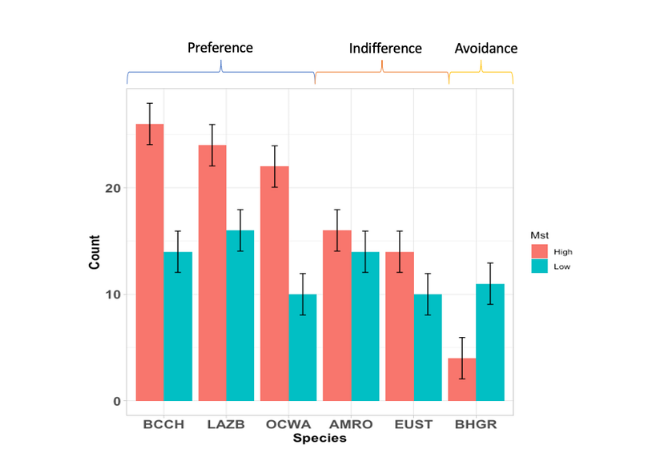
Figure 6. - Frequency counts of the six most observed species driving dissimilarity within 5 Oregon sites of high/low mistletoe infection levels. Error bars representative of 95% confidence intervals, and four letter codes representative of species. The descriptors above the graph relate to the species behavior towards high mistletoe infected forests. Data modified and sourced from an Oregon study by Pritchard et al. (2017)
|
In addition to the multidimensional scaling matrix, where similarities between species microhabitats and preferences were discovered. a more detailed view of the six most observed species was also created (Figure 6). These species were determined from the MDS above. This figure shows the counts and relative preference towards mistletoe infection levels as per Pritchard et al. (2017). Error bars represent 95% confidence intervals, calculated using standard deviation and sample size to get standard error, which was multiplied by 1.96 SE. 95% intervals were used to better account for small sample groups. Non-overlapping confidence intervals were then used to assign avian preference, with species with high mistletoe infection counts, and non overlapping error defined as mistletoe preferred, overlapping intervals and mistletoe indifferent, and low infection as mistletoe avoidant. Figures 3.0 to 3.5 are box plots comparing high and low mistletoe infection levels against different forest attributes. |
Statistical Analysis
Objective 1: Permutational Anova (PERMANOVA) and Pairwise Comparison (Tukey's significance test)
Table 3. - Complied PERMANOVA output for mean differences, in the microhabitat characteristics and species (forest parameters), between sites of low (0-30 plants) and high (at least double the lowest tree in a site) mistletoe infection. Forest parameters (far left column) composed the response variable for their respective, independent study. Source columns are indicative of sources of variance, with mistletoe levels (mst) being the primary predictor, and the five sites (site) being the covariate. Green markings represent a significant p-value and favorable mean squares, while the yellow marking indicates near significance, as per α = 0.05 . Analysis of variance and Shapiro-Wilk's/ Levene's tests conducted within R statistical software (R Core Team, 2021). Forest parameters were measured from a total of 60 white oak trees using a variety of traditional methods, under a diversity survey within Willamette Valley, Oregon (Pritchard et al., 2017).
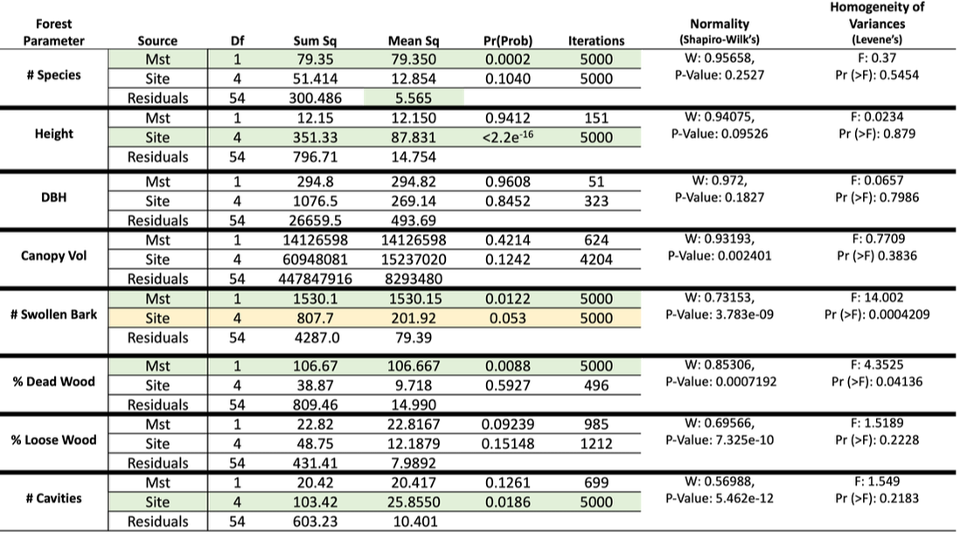
Considering PERMANOVA results, tree height, dead wood and swollen bark amounts, and number of tree cavities were the only tests with some significant difference when considering with probability statistics less than alpha values of 0.05. With the exception of tree cavities, mean squares for the significant sites or mistletoe levels in these parameters greatly exceed any residual or confounding mean mean squares, which indicate much of the variance being controlled by either mistletoe for species, swollen bark and dead wood, and by site location for tree height and cavities. Tree cavities differences may then be confounded by site differences.
Table 4. - Tukey Honestly Significant Difference (HSD) pairwise comparison for a PERMANOVA of four forest parameters under mistletoe infection. Forest parameter and sources indicate the combination of predicator/response variables which were significantly different following an analysis of variance at α=0.05, and are listed as high levels over low; in the case of sites, the site containing the higher mean parameter is listed first. Yellow marking representative of a near significant value. Pairwise comparisons conducted within R statistical software (R Core Team, 2021), while originating from diversity survey data within Willamette Valley, Oregon (Pritchard et al., 2017).

Objective 2: Linear Regression, PERMANOVA, and Pairwise comparisons (Tukey's significance test)
|
|
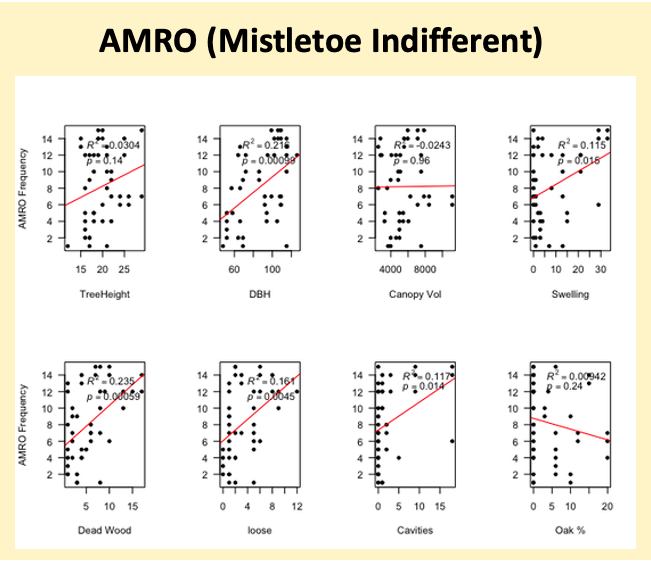
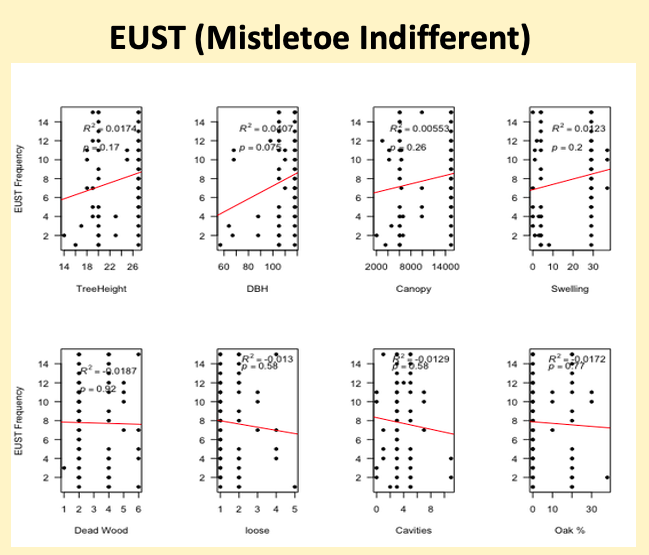
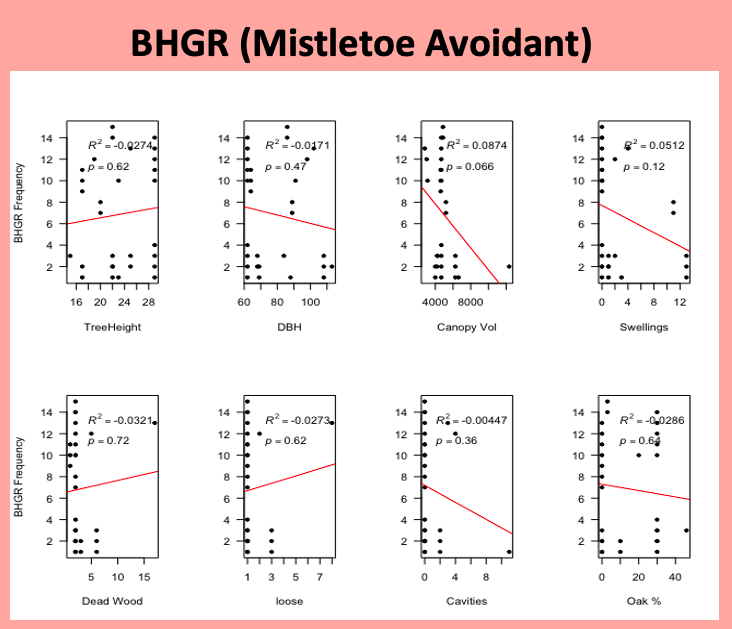
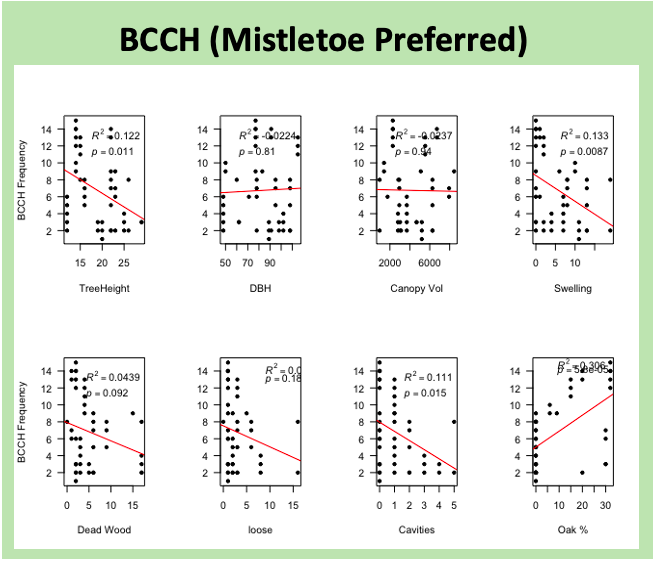
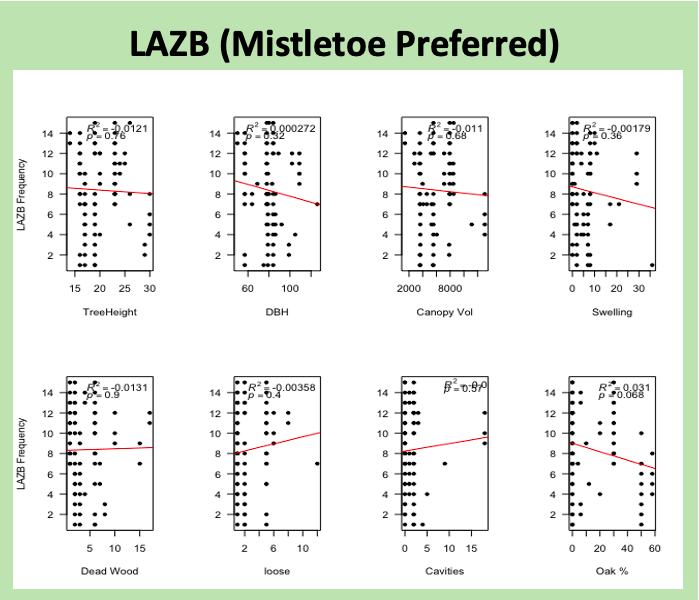
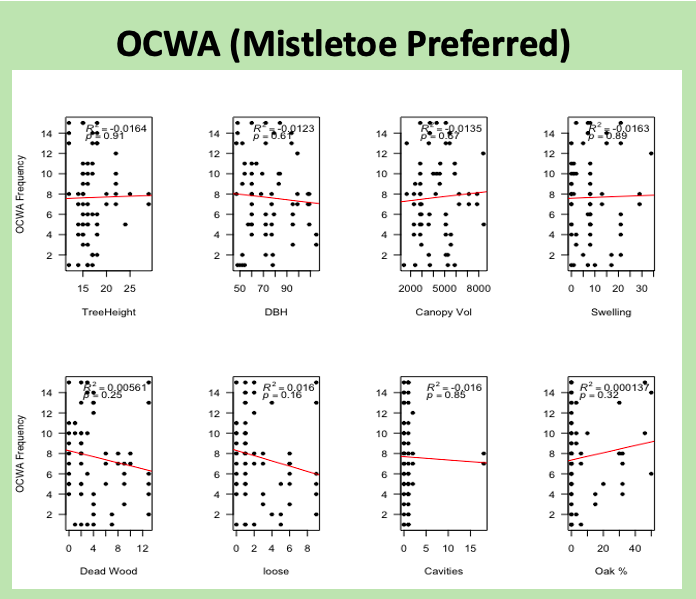
Figure 7. - Linear regression plots six abundant species, classified as mistletoe preferred (BCCH. OCWA, WEWP), mistletoe neutral (AMRO,EUST), and mistletoe deterred (black-headed grosbeak (BHGR)), across eight forest parameters, as per diversity surveys by Pritchard et al. (2017). Species, represented by four letter codes as defined by Pritchard et al. (2017), are represented within coloured boxes. Linear regressions compose of woody forest parameters as predicator variables, and respective species frequency as response variables. Red lines are representative of the regression line, while R^2 indicates the correlation coefficient, and p-value significance set at α = 0.05. Bird frequencies were measured using visual methods, while forest parameters were measured from a total of 60 white oak trees using a variety of traditional methods under a diversity survey within Willamette Valley, Oregon (Pritchard et al., 2017).
Linear regressions overall indicated no discernible difference between the six species estimated to be either preferred, indifferent, or avoidant. Out the six chosen, only BCCH and AMRO showed significant regression. Mistletoe preferred species like BCCH were expected to show a positive correlation with woody parameters given heightened foraging and nesting opportunities. However, the species showed significant, decreasing relationships with swelling and cavities, and an increasing correlation with oak. Coincidentally, AMRO, the mistletoe indifferent species, showed significant, positive relationships with woody parameters. While correlation was weak across all parameters in all species, a pattern between estimated mistletoe preference and avian frequency can loosely be seen: BHGR in most parameters is clumped on the left side of these x-axises, or increasing in frequency at low levels of all woody parameters. Meanwhile, AMRO and EUSt show a more mixed and evenly distributed grouping of data points. Therefore, while species are similar as per Bray Curtis distance graphs on account of greater dead woody, loose wood, and other woody parameters, other ecological factors may drive differences between sites, or greater sampling efforts are required to more precisely describe avian relationships.


|


|
Figure 8. Complied PERMANOVA output for mean differences in frequencies of avian species between 5 sites of low (0-30 plants) and high (at least double the lowest tree in in a site) mistletoe infection. Avian species (far left column, four letter code) composed the response variable variable for their respective analysis, with their estimated preference of mistletoe (preference, neutral, avoidance) indicated. Source columns are indicative of sources of variance, with mistletoe levels (mst) being the primary predictor, and the five sites (site) being the covariate. Green markings represent a significant p-value and favorable mean squares, as per α=0.05 . Analysis of variance and corresponding Shapiro-Wilk's and Levene's tests conducted within R statistical software (R Core Team, 2021). Bird frequencies were measured using visual methods, under a diversity survey within Willamette Valley, Oregon (Pritchard et al., 2017).

Figure 11. Tukey Honestly Significant Difference (HSD) pairwise comparison for a PERMANOVA of six bird species preferences under mistletoe infection. Bird species and sources indicate the combination of predicator/response variables which were significantly different following an analysis of variance at α =0.05, and are listed as high levels over low; in the case of sites, the site containing the higher mean parameter is listed first. Pairwise comparisons conducted within R statistical software (R Core Team 2021), while originating from diversity survey data within Willamette Valley, Oregon (Pritchard et al. 2017).
Permutational anova on mistletoe and site frequencies also showed few mean differences between species, despite BCCH consistently showing strong preferences for high mistletoe. However, one can infer from regressions that drivers of BCCH in high mistletoe sites likely are not in part to woody parameters in this study, but likely some other factor such as decreased predation or easier nesting. Greater numbers of chickadees were also expected at baskett sites, with four more individuals per any group on average. BHGR was the only other significant finding, which relates to its preference for finley sites, with 6 greater mean individuals in any one observation
Applications and Management
Overall, a management regime that would benefit the entirety of all biotic components would likely be prescribed burning/under-burning. This technique involves the application of fire to an area to achieve management goals (often natural restoration of a specific land back to its original state) (Government of British Columbia, n.d.). Prescribed burns/under burns do not eradicate the entirety of trees from forests, unlike clear-cutting, which remove all trees within the cutblock. Prescribed burns also do not eradicate dead and injured trees from forests unlike salvage cutting. These trees often create the best habitat for avian species. In this management regime, mistletoe infection will be maintained at or below a level which allows the microhabitats that are created from mistletoe infections to still be present in the forest (deadwood, loose wood and cavities). This management technique also will not allow the infection to spread to levels that can risk the health and survival of the forest stand. Therefore, with regular controlled burning, avian diversity is expected to be maintained in these forests without risking the health of the tree species from infection takeover (Conklin & Armstrong, 2005). Habitat loss in areas of Oregon and throughout western North America have been very high because of the plentiful and quality forest products that exist in this area. Forestry is expected to continue in these areas for many years to come. A more sustainable forest harvesting regime should be practiced to ensure biodiversity is maintained. Considerations of information from studies such as this to plan cut block layouts and harvesting areas can maintain avian biodiversity within these systems. An implication that relates to this, is the use of uneven aged harvest. This management method still allows harvest and it can be thought to produce similar effects as prescribed burning and under burning would.
