|
Study data was obtained from previous research by Pritchard, Hagar, and Shaw (2017). White Oregon oak (Quercus garryana) trees were measured for microhabitat characteristics and diversity at 5 locations within Willamette Valley, Oregon, USA (Figure 1). Data was collected from 60 oak trees, where each one was paired with a low and high level of oak mistletoe (Phoradendron villosum) (30 low,30 high). Oak trees were paired based on a defined criteria, to control for confounding effects. This includes:
Defined criteria for choosing pairs of oak trees.
Refer to Table 1 for microhabitats measurements. A total of 180 bird surveys were performed by biologists and wildlife cameras from May 1st to July 1st of 2014 (Pritchard, Hagar, & Shaw, 2017). Presence/absence data was used to limit abundance count errors, or observer inconsistencies.
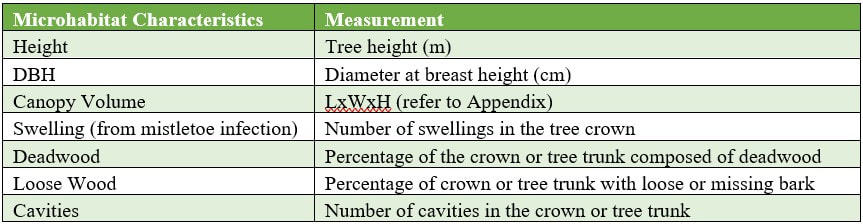
Table 1. Microhabiat characteristics and their measurement
Using R software, each tree was given a unique ID and only characteristics in Table 1 were analyzed. Exploratory data was conducted through box-plots and pairs plot between infection levels and each microhabitat characteristic. A bar graph analysis, with 95% confidence intervals, was then used for six of the most observed species. A non-metric multidimensional scaling (NMDS) using Bray-Curtis distance matrix was used to define the similarity between infection levels and microhabitat charcteristics across trees. Then, multidimensional (ordination) scaling matrix was used to measure dissimilarity of mistletoe infection and species presence.
Appendix lists bird species and their codes for this study. Statistical AnalysisFor objective 1, a permutational anova (PERMANOVA) was undertaken for each parameter to test for significant differences between microhabitat characteristics and infection level. Parameters served as the response variable for predictor mistletoe levels, while the 5 sites were considered as a potential influence and included as a covariate. Microhabitat parameters showing a significant difference between mistletoe groups, or showing a high level of variation/significance between sites, were then followed up with pairwise comparisons (Tukey's Significance test, 95% confidence level). Given that two predictors were used, sequential sum of squares was used to quantify the sum of squares reduction and increase proximity to a non-parametric ANOVA.
For objective 2, the six most observed species, and those driving dissimilarity were plotted in multiple linear regression plots to compare their relationship (positive, negative, or neutral) with microhabitat characteristics. Correlation coefficients and regression p-values were then used to confirm any apparent preference/avoidance of mistletoe that could be observed from the data, and allow inference on the microhabitats needed for mistletoe preference, neutrality, or avoidance. In regards to frequency counts between mistletoe levels and site locations, PERMANOVA and Tukey's Significance test was conducted in a similar manner to objective 1. However, the additional covariate of mistletoe effects combined with site geography effects were included given the dispersal ability of birds in the area. Data was sourced from a second set of survey reports by Pritchard et al. (2017) |
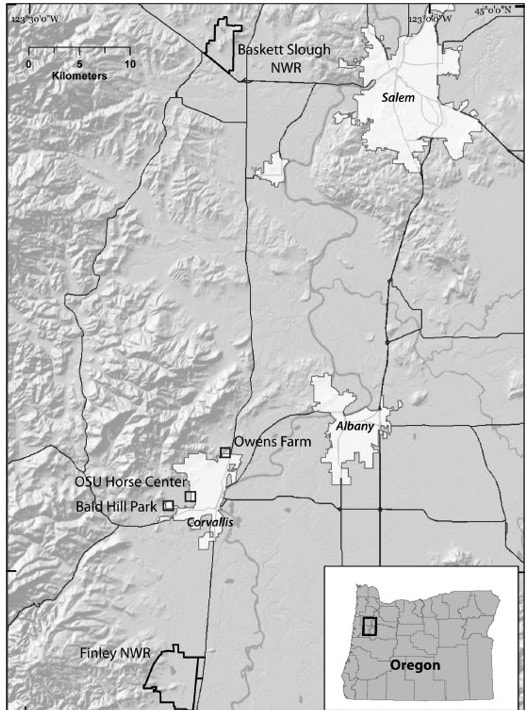
Figure 1. Map displaying the 5 study locations within Willamette Valley (Oregon): Finley National Wildlife Refuge, Basket Slough National Wildlife Refuge, Owens Farm, OSU Horse Center, and Bald Hill Park. Map from Pritchard, Hagar, and Shaw (2017).
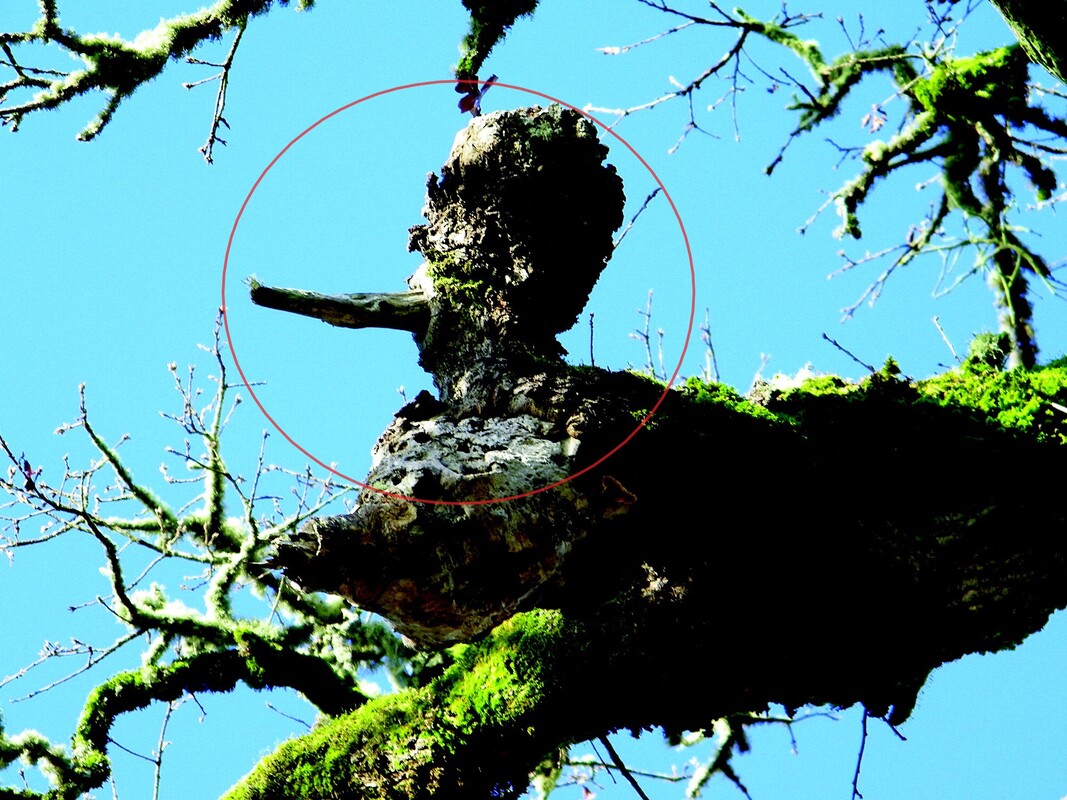
Swelling on an oak tree caused by mistletoe. Photo by Kyle Pritchard in Pritchard et al. (2017).
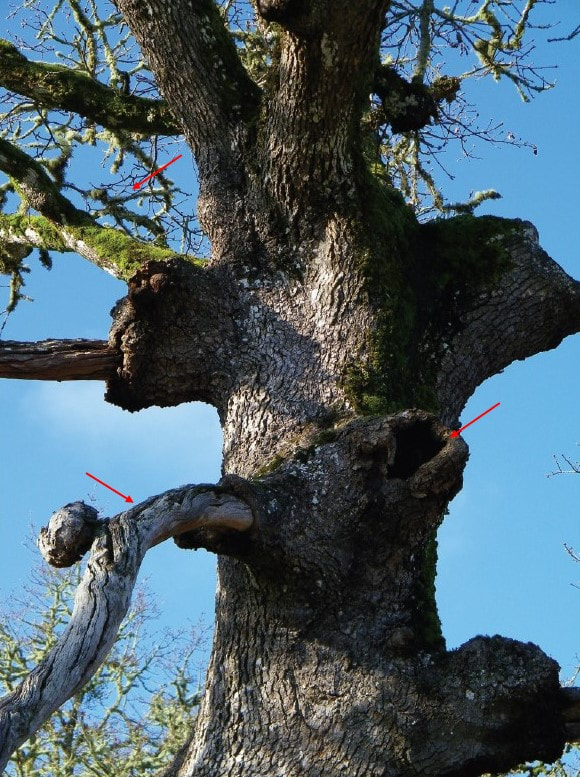
Mistletoe infected tree showing cavities, dead wood, and loose wood (indicated by red arrows). Photo by Kyle Pritchard in Pritchard et al. (2017).
|
